| |
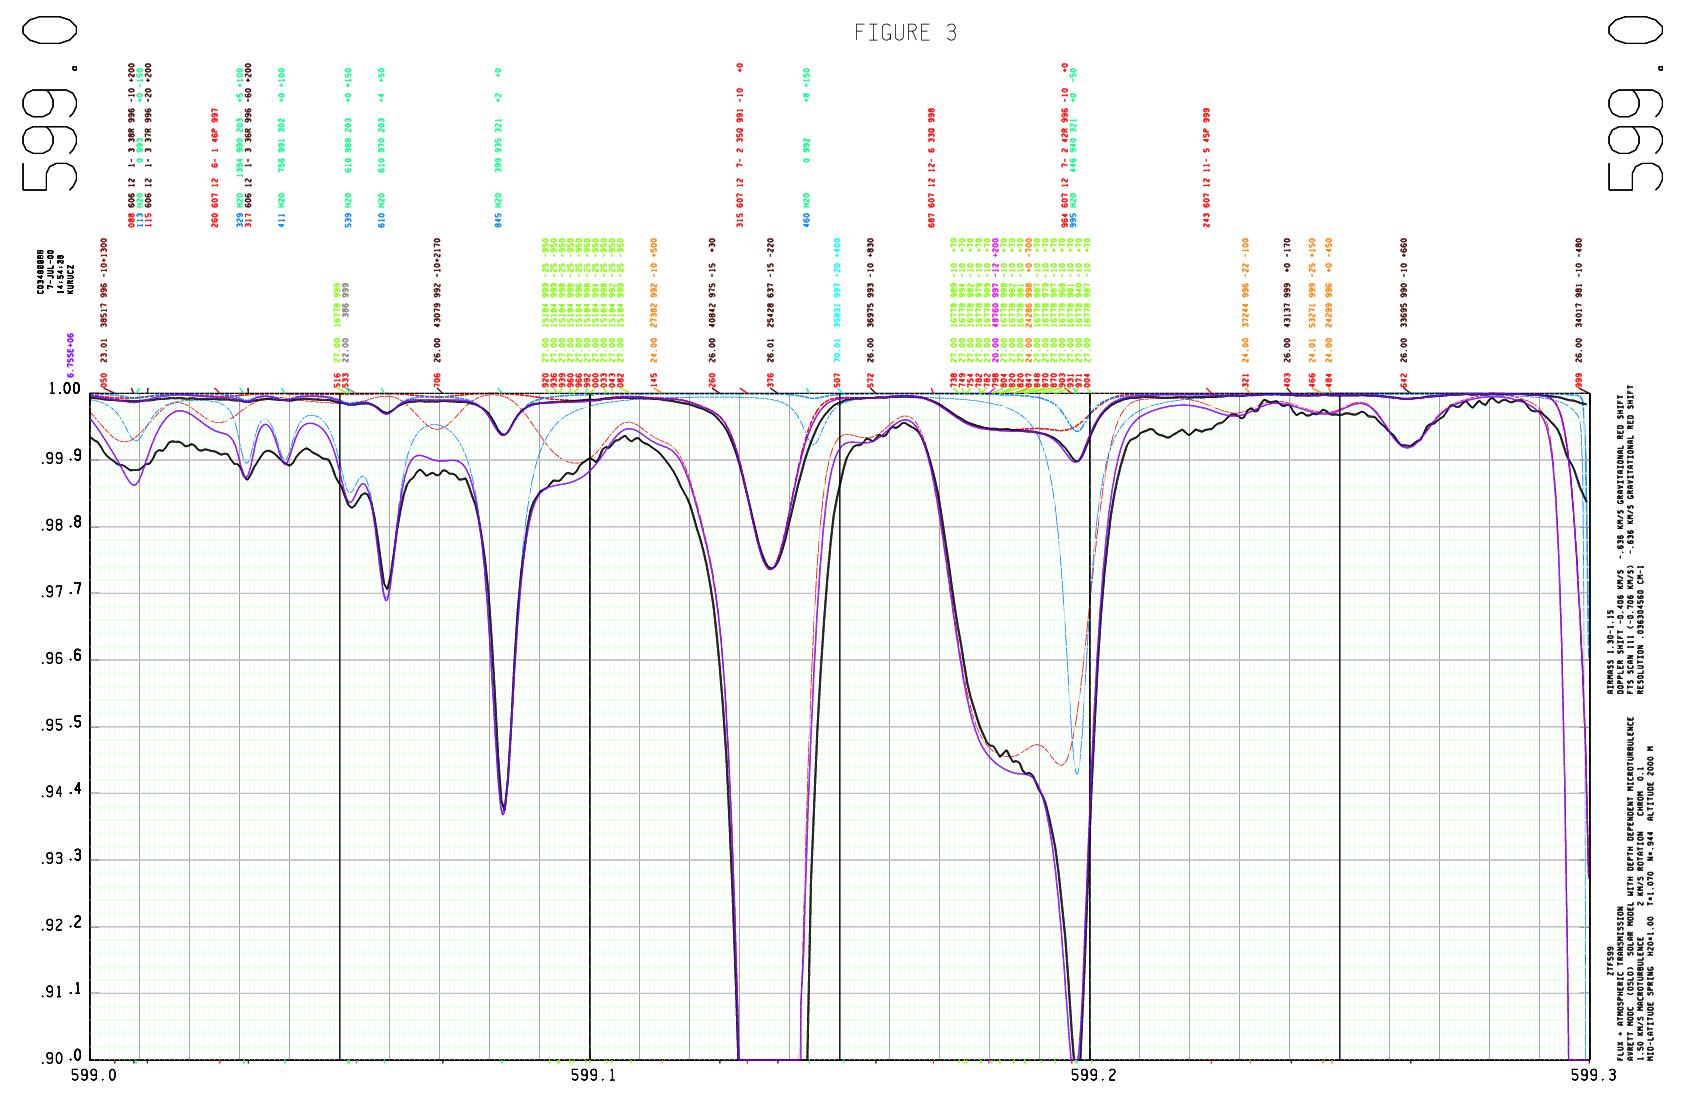
A small section of the solar flux spectrum at 599nm
plotted at full scale and at 10-times scale. The heavy black lines show the
observed spectrum from the Kitt Peak Solar Flux Atlas from 300 to 1000 nm
(Kurucz 2005). The resolving power is about 300000 and the signal-to-noise
is about 3000. Higher quality spectra would be helpful because the spectrum
is not resolved and because weaker features would appear at higher
signal-to-noise.
The thin lines are the computed spectra: in red for the solar flux,
in blue for the telluric atmospheric transmission, and in purple for their
product which should be compared to the observed heavy black lines.
The computed spectra are broadened to resolving power 0.05666 cm$^{-1}$
to match the observed spectrum. There are solar lines of Ca I, Ti I, Cr I,
Cr II, Fe I, Fe II, Co I, Yb II, C$_2$, CN, and
telluric lines of H$_2$O. The first number in each line label is the last
3 digits of the wavelength. The second number is the species code which is
the atomic number plus 0.01 times the charge. The middle numbers are either the
lower energy level in cm$^{-1}$ for atoms or quantum numbers for molecules.
The 4th number is the per mil line depth if the line were computed in isolation.
Two of the Co I lines have been divided into hyperfine components. The
hyperfine and isotopic splittings have not yet been determined for the other
lines. Some splittings may be negligible. There are many missing lines.
The lines that are present have been adjusted to improve agreement between
the calculated and observed spectra. That process is continuing. This sample
will be part of a forthcoming flux atlas with line identifications.
|
|